3D from Scratch - Day 1
First day of seeing if I can figure out retro 3d graphics from scratch. (To catch up on this series, go here.)
My task for today: make a wireframe cube that I can move around with the cursor keys. In 3D.
This is going to be a test to see whether this is a remotely plausible project. Because if I can’t figure this out, I’ve got no hope for the rest of it…
CUBE!
Preliminary setup. The HTML file, with text if Canvas isn’t supported in the user’s browser:
<canvas>Too bad.</canvas>
And the size our screen is going to be (for now):
// Our retro "screen" resolution
var PIXEL_WIDTH  = 160
var PIXEL_HEIGHT = 120
Step 1: Make a screen of pixels using Canvas
First job is figure out how to use Canvas in such a way that it seems as though it’s a simple screen of (huge) pixels. This is harder than you might think, for two reasons:
- Every Canvas drawing function is anti-aliased, and bugger if I can figure out how to turn that off. I don’t think it’s possible.
- Even if I could turn it off, the pixels on a modern screen are tiiiiiny. There’s no setting in canvas called “set pixel size = 10” or anything like that.
Now I had a few options here, and I’ve gone ahead and chosen the worst. But also the fastest to get up and running. I’ll revisit it later.
That is: I’ll use the canvas fillRect function to draw little squares where the pixels should be. Onwards!
// Actual space we can use in the browser window
var WIN_WIDTH  = window.innerWidth
var WIN_HEIGHT = window.innerHeight

// Calculate how big we can make the virtual pixels
// (In whole numbers, can't have our virtual pixel be 2.5
// real pixels, that would look terrible)
var ratio_width  = WIN_WIDTH / PIXEL_WIDTH
var ratio_height = WIN_HEIGHT / PIXEL_HEIGHT
var pixel_size = Math.floor(Math.min(ratio_width, ratio_height))

// Resize the canvas
var canvas = document.getElementById("canvas")
canvas.width = PIXEL_WIDTH * pixel_size
canvas.height = PIXEL_HEIGHT * pixel_size

// Get the context, which is where you do all the actual drawing
var ctx = canvas.getContext("2d")

// Make it a black screen
ctx.fillStyle = "black"
ctx.fillRect(0, 0, PIXEL_WIDTH*pixel_size, '' PIXEL_HEIGHT*pixel_size)

// function to set a pixel (to the colour set with fillStyle)
function setPixel(ctx, x, y) {
  if (x > 0 && x < PIXEL_WIDTH && y > 0 && y < PIXEL_HEIGHT)
    ctx.fillRect(x*pixel_size, y*pixel_size, pixel_size, pixel_size)
}
That looks good. And a little demo to check it works right:
ctx.fillStyle = "white"
for (var x = 0; x < PIXEL_WIDTH; x++) {
  setPixel(ctx, x, Math.floor(30*Math.sin(x/10)) + 55)
}
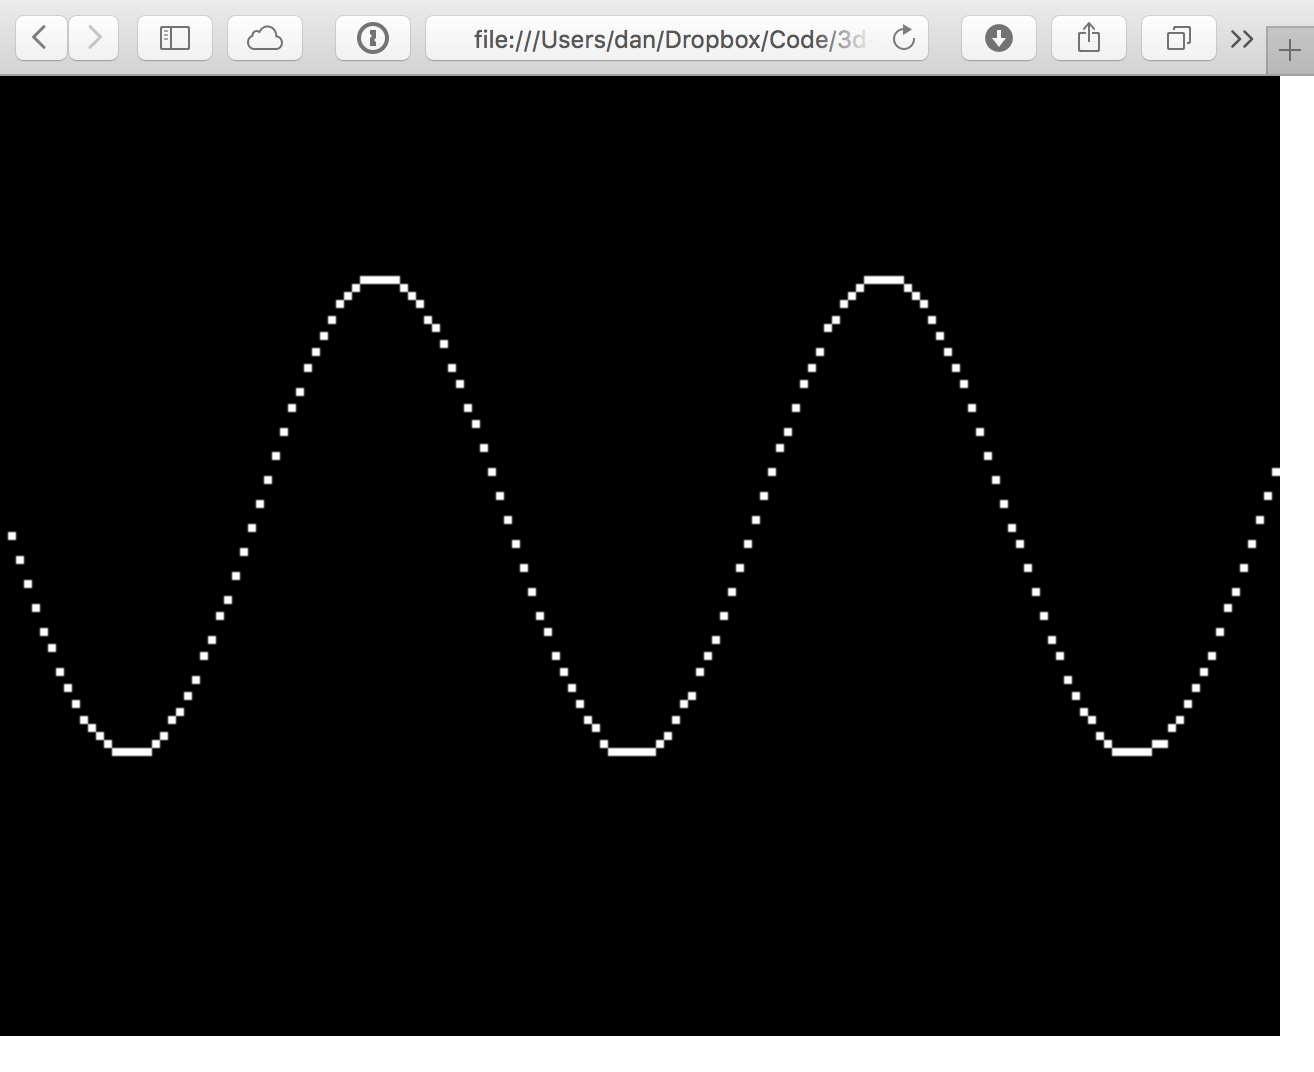
Suitably retro. OK, we have our screen.
Step 2: Draw the points of the cube
OK, let’s get straight in there and draw the corners of the cube as single pixels, in 3D.
Mental visualisation. I’m here, floating in space, looking straight ahead. There’s a cube hovering in front of me. How do I turn all that into a 2D screen?
After some thought, I’ve decided that this mental visualisation has to include the screen as well, as a flat rectangle hovering directly in front of me, between me and the cube. You can then find the location of any point on the cube on the screen, by drawing a line from the my eye to the point on the cube, and marking where exactly it intersects the screen.
This makes the picture on the screen the projection of the cube. I recall projection being a thing from Maths.
Terrible diagram of this (the first of many):
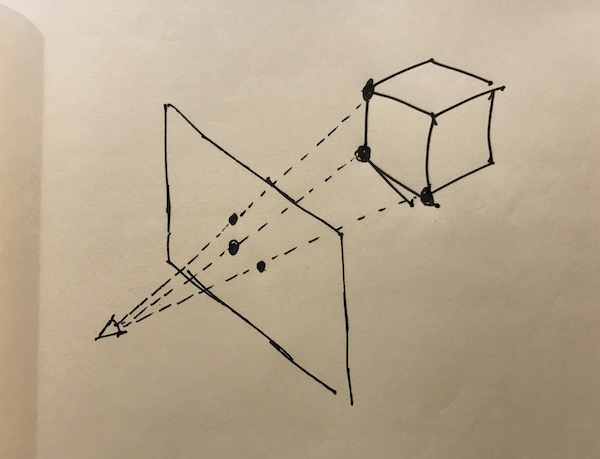
I’m not a fan of trigonometry, but I think if you threw enough of it at this, you could figure out the locations of the points on the screen in pixels.
But I’m a bit at a loss as how to code this straight away, so let’s simplify by tossing out the x-axis and just considering one point to start with.
To make things as easy as possible, I’m going to assume that the camera is at (0, 0, 0), that it is looking… up… the z-axis, and that the screen is a… units… up the z-axis, and that the cube is b units up the z-axis, and has … 2c units to a side. (Can you tell I’m making this up as I go along?)
This means that the x and y axes of the screen are aligned with the x and y axes of the space it’s floating in, again to simplify things. That the centre point of the screen is _x = 0, y = 0, z = a.
That gives me this diagram:
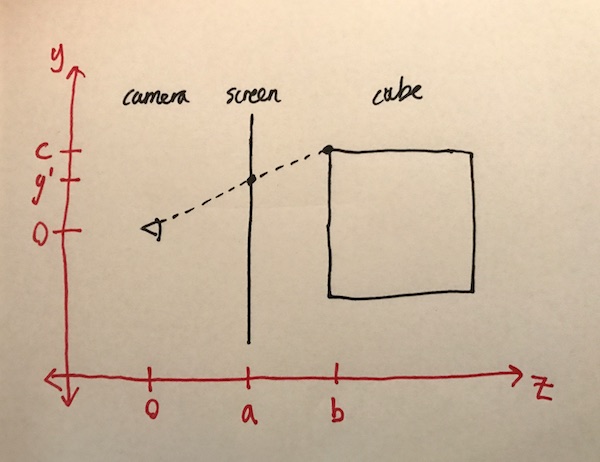
Now to draw the point on the screen, I need to know the y pixel coordinate, which is marked as y’. (We’re forgetting about x coordinate for a minute.)
The y coordinate of the pixel is something like c, but a bit less because of the perspective.
If I redraw that highlighting the triangle formed by the camera location, the point in 3D space, and the midpoint of the cube line, it becomes easy to see how to derive y’:
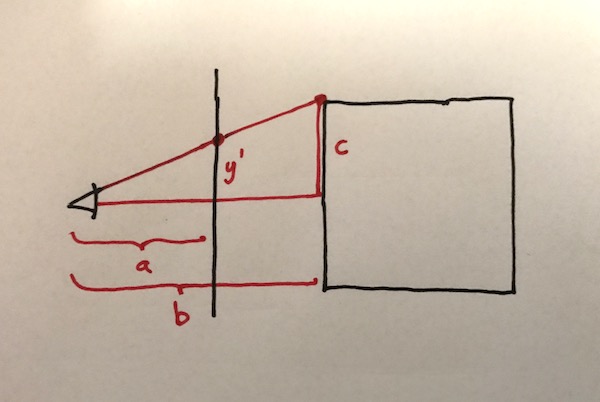
Because it’s a right-angled triangle, the value of y’ is proportional to c in the same ratio as the distance that the screen is along the base of the triangle. In other words, y’ = c(a/b). And that’s our screen coordinate!
And this works exactly the same in both the x-axis and the y-axis! (You can imagine the diagram with x-axis in place of the y-axis and nothing changes.) That means we can calculate the pixel coordinates (of that single point) now:
// cube corner, x and y are 'c' and z is 'b' in the diagram above
var p = {x:50, y:50, z:200}

// screen distance from camera is 'a' in the diagram above
var screen_dist = 100

var screen_coordinates = {
  x: Math.round(p.x*screen_dist / p.z),
  y: Math.round(p.y*screen_dist / p.z)
}
And let’s draw it like this:
ctx.fillStyle = "white"
setPixel(ctx, screen_coordinates.x, screen_coordinates.y)
Fingers crossed…
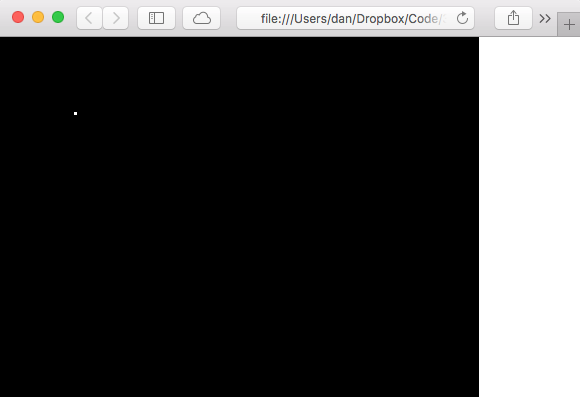
BOOM! A point! In 3D!
I mean I guess it looks like it’s in about the right place… Lets draw the rest of the cube to see. First I’ll wrap up the point drawing code into a function, then draw the rest of the points.
function drawPoint3d(ctx, p) {
  var x = Math.round(p.x * (screen_dist / p.z))
  var y = Math.round(p.y * (screen_dist / p.z))
  setPixel(ctx, x, y)
}

var cube = [
  { x: 50,  y: 50,  z: 250},
  { x: 50,  y: 50,  z: 150},
  { x: 50,  y: -50, z: 250},
  { x: -50, y: 50,  z: 250},
  { x: 50,  y: -50, z: 150},
  { x: -50, y: 50,  z: 150},
  { x: -50, y: -50, z: 250},
  { x: -50, y: -50, z: 150}
]

ctx.fillStyle = "white"
for (var i = 0; i < cube.length; i++) {
  drawPoint3d(ctx, cube[i])
}
And the result:
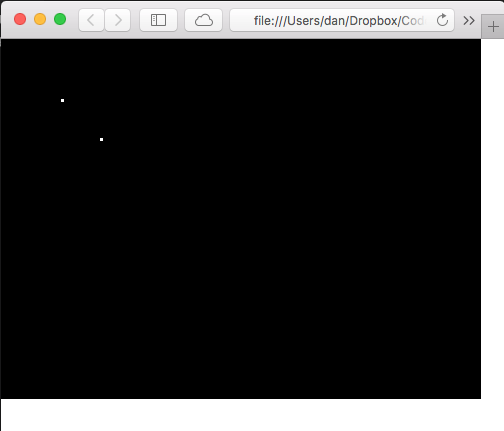
OK well that looks even more amazingly 3D than the last one!
Although it’s obviously centered the cube at (0, 0) on the screen… so let’s make sure to translate that screen half way in both axes so that the centre of the screen is at x=0, y=0.
function drawPoint3d(ctx, p) {
  var x = Math.round(p.x * (screen_dist / p.z))
  var y = Math.round(p.y * (screen_dist / p.z))
  setPixel(ctx, x + PIXEL_WIDTH/2, y + PIXEL_HEIGHT/2)
}
And the result is very definitely a 3D cube!
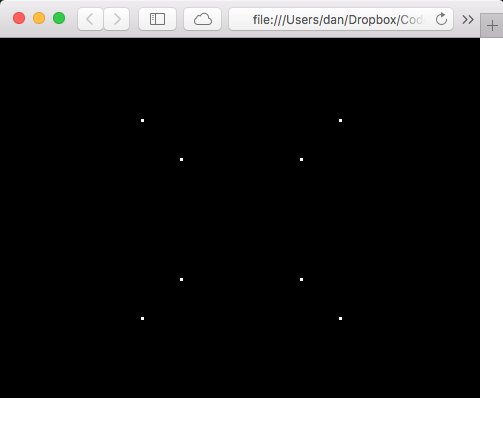
And no trigonometry required at all. 🎉
Step 3: Move the cube with cursor keys
OK I want to be able to move this baby around, really feel the 3D.
Shouldn’t be too hard, just need to hook into some JS key events and change the cube coordinates if the cursor keys are pressed.
First let’s maintain the state of the cursor keys using JavaScript document events:
var keyState = {
  up: false,
  down: false,
  left: false,
  right: false,
}

document.addEventListener('keydown', function(e) {
  if (e.keyIdentifier == "Up")    keyState.up = true
  if (e.keyIdentifier == "Down")  keyState.down = true
  if (e.keyIdentifier == "Left")  keyState.left = true
  if (e.keyIdentifier == "Right")  keyState.right = true
})

document.addEventListener('keyup', function(e) {
  if (e.keyIdentifier == "Up")    keyState.up = false
  if (e.keyIdentifier == "Down")  keyState.down = false
  if (e.keyIdentifier == "Left")  keyState.left = false
  if (e.keyIdentifier == "Right") keyState.right = false
})
Now, if this is going to move about then I’m stepping into animation territory, which means I should switch to doing all my drawing inside a window.requestAnimationFrame call. (This allows the browser to call your function that draws a frame whenever it decides that it is time for a new frame to be drawn.)
It’s also going to have to keep track of where the cube is. I decided not to change the values of the coordinates in the cube points every time it moves, but just to keep track of the change in the points in a separate variable:
var transform = {x: 0, y: 0, z: 0}
Now I’ll have a drawFrame function that requestAnimationFrame can call. It needs to clear the screen before it renders the points each frame, and update the transform if it detects that the keys are pressed.
I’ll only have it move in the z and x axes (as there are only four cursor keys).
function drawFrame() {
  // clear frame
  ctx.fillStyle = "black"
  ctx.fillRect(0, 0, PIXEL_WIDTH*pixel_size, PIXEL_HEIGHT*pixel_size)

  // draw points
  ctx.fillStyle = "white"
  for (var i = 0; i < cube.length; i++) {
    var p = cube[i]
    // move point based on transform
    var newP = {x: p.x + transform.x, y: p.y + transform.y, z: p.z + transform.z}
    drawPoint3d(ctx, newP)
  }

  // update cube location
  if (keyState.down)  transform.z -= 10
  if (keyState.up)    transform.z += 10
  if (keyState.left)  transform.x -= 10
  if (keyState.right) transform.x += 10

  window.requestAnimationFrame(drawFrame)
}

// start the whole thing off:
window.requestAnimationFrame(drawFrame)
And that should do it!
Step 4: Write a function to draw lines
This is just a set of points floating around. To make it a real cube it needs to be wireframe, and that means… I have to figure out how to draw lines. To be honest I’ve been putting this off a little bit, because I have no idea how to do it, but it’s clearly time now.
I spent quite a bit of time figuring this out, way longer than on the 3D point drawing. I’m not going to tell you all my errant thought processes here, so I’ll just show you a few lowlights.
The goal is to turn a platonic “perfect” line between two points into a set of illuminated pixels that approximate that line in a “nice” way (see the illustration below). The points at the start and end of the line are always at the exact centre of two pixels.
Now if you draw a few of these it becomes clear pretty quickly that sometimes it can be done more nicely than others. For instance line II in this diagram is a little unbalanced, and will appear a little curved on the screen, but there is just no way to do it better.
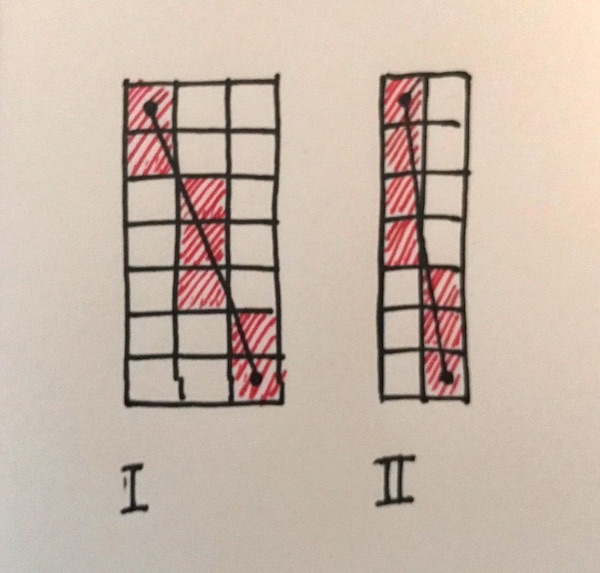
Red Herring Number 1. First thing I did was get properly side-tracked into trying to create a recursive algorithm. The first line in the diagram above passes through the exact midpoint of a pixel in the middle of the line. Therefore you can decompose the problem into two around that midpoint, and recursively call your line drawing algorithm with those two halves. This seemed to me to be very promising.
The problem is there’s no way to do the same for line II (or none that I can see) because the line midpoint falls on the boundary between two pixels, so the sub-problems don’t obey the constraint of starting and ending at the centre of two pixels. And there are more cases like this. So this turned out to go nowhere.
Solution Eventually I noticed that (for a line that runs with a steep slope downwards, like Line I and Line II in the diagram), for each row of pixels there is only one active. This led me to think about how you would pick which of the row to activate. The answer is to look at the horizontal line that passes through the midpoint of the row of pixels, and ask: in which pixel does the perfect line intersect this midpoint horizontal line? Here’s what that looks like:
![]()
You can see that the intersections are in the correct pixels for this line.
That’s pretty easy to code up (remember we’re assuming that the line slopes down and to the right severely). We step along the perfect line, increasing y by one each time and increasing x by the proportional amount. It’s the Math.round call that’s doing the work of selecting the pixel in the row:
function drawLine(ctx, x1, y1, x2, y2) {
  var x = x1
  var y = y1
  var slope = (x2 - x1) / (y2 - y1)
  while (y <= y2) {
    setPixel(ctx, Math.round(x), y)
    y++
    x += slope;
  }
}
And a demo:
// inside drawFrame
ctx.fillStyle = "yellow"
drawLine(ctx, 10, 10, 10, 50)
drawLine(ctx, 10, 10, 20, 50)
drawLine(ctx, 10, 10, 30, 50)
drawLine(ctx, 10, 10, 40, 50)
drawLine(ctx, 10, 10, 50, 50)
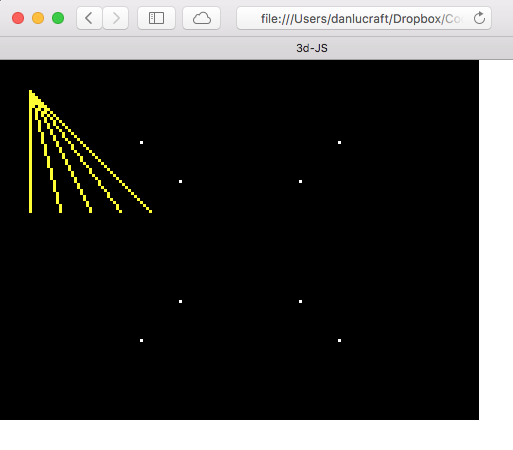
So that looks right. Now we need to consider the cases where the line doesn’t slope down and to the right like that.
First of all, there’s no reason that we have to consider lines that run from right to left. We can just swap the ends, and then for the rest of the function we are guaranteed they run from left to right:
function drawLine(ctx, x1, y1, x2, y2) {
  // ensure line from left to right
  if (x2 < x1) {
   var xt = x1
   var yt = y1
   x1 = x2
   y1 = y2
   x2 = xt
   y2 = yt
  }
  ...
Once we’ve done that, there are four cases to consider. If we calculate the slope of the line as s, which is change in x over change in y:
var s = (x2 - x1) / (y2 - y1)
Then the cases are:
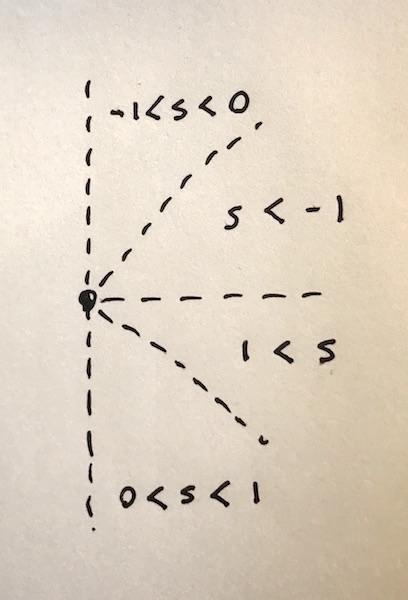
For the two more horizontal cases, the algorithm steps along x one a time (instead of y) and looks to see which pixel in the column (instead of row) of pixels should be activated:
![]()
Now we can code up those cases, very similar to the previous ones. The differences in each case are:
- whether it is y or x that is incremented at each step
- if y, whether it is incremented or decremented (line goes down or up)
-
if we are scanning across columns (x is being incremented), then y needs to change by 1/s, rather than s. This is because we expressed s as “change in x per y” but now we need “change in y per x”.
if (s > 0 && s <= 1) {
  while (y <= y2) {
    setPixel(ctx, Math.round(x), y)
    y++
    x += s
  }
} else if (s < 0 && s >= -1) {
  while (y >= y2) {
    setPixel(ctx, Math.round(x), y)
    y--
    x -= s
  }
} else if (s < -1) {
  while (x <= x2) {
    setPixel(ctx, x, Math.round(y))
    x++
    y += 1/s
  }
} else if (s > 1) {
  while (x <= x2) {
    setPixel(ctx, x, Math.round(y))
    x++
    y += 1/s
  }
}   }
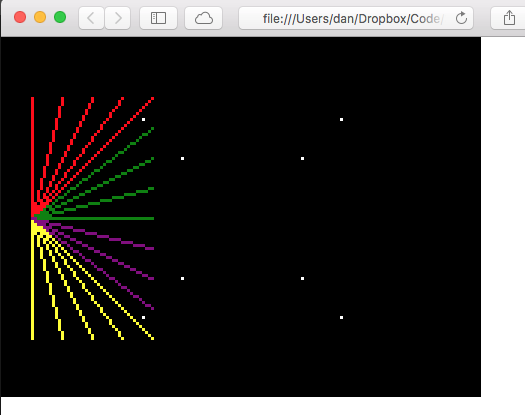
And try a demo with different colours for each of the four cases:
  ctx.fillStyle = "yellow"
  drawLine(ctx, 10, 60, 10, 100)
  drawLine(ctx, 10, 60, 20, 100)
  drawLine(ctx, 10, 60, 30, 100)
  drawLine(ctx, 10, 60, 40, 100)
  drawLine(ctx, 10, 60, 50, 100)

  ctx.fillStyle = "red"
  drawLine(ctx, 10, 60, 10, 20)
  drawLine(ctx, 10, 60, 20, 20)
  drawLine(ctx, 10, 60, 30, 20)
  drawLine(ctx, 10, 60, 40, 20)
  drawLine(ctx, 10, 60, 50, 20)

  ctx.fillStyle = "green"
  drawLine(ctx, 10, 60, 50, 30)
  drawLine(ctx, 10, 60, 50, 40)
  drawLine(ctx, 10, 60, 50, 50)
  drawLine(ctx, 10, 60, 50, 60)

  ctx.fillStyle = "purple"
  drawLine(ctx, 10, 60, 50, 70)
  drawLine(ctx, 10, 60, 50, 80)
  drawLine(ctx, 10, 60, 50, 90)
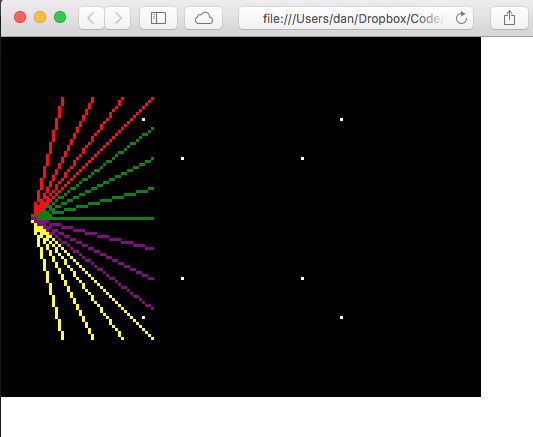
Which looks pretty good… Except we’re missing the vertical lines.
This puzzled me a bit. In both upwards and downwards vertical lines the slope s is zero. The difference is that s is either +0, or -0. Of course you can’t distinguish those with an inequality condition, so we can just check whether the second y coordinate is bigger or lesser than the first. Adding that to the code:
  if ((s > 0 && s <= 1)) || (s == 0 && y2 > y1)) {
    ...
  } else if ((s < 0 && s >= -1)) || (s == 0 && y2 < y1)) {
    ...
  } else if (s < -1) {
    ...
  } else if (s > 1) {
    ...
  }
And bingo!
Step 5: Draw the wireframe cube
The line drawing seems to be working. Let’s hook it up to the cube and win!
We need a description of which edges we want, which I’ve chosen to do in terms of which corners to go from and to. Here the numbers are indexes into the cube array of points from before:
var edges = [
  [0, 1],
  [0, 2],
  [0, 3],
  [1, 4],
  [1, 5],
  [2, 4],
  [2, 6],
  [3, 5],
  [3, 6],
  [4, 7],
  [5, 7],
  [6, 7],
]
And here’s a function that copies the code from drawPoint3d that turns the 3D points into screen coordinates, and then just draws the line between them:
function drawLine3d(ctx, p1, p2) {
  var x1 = Math.round(p1.x * (screen_dist / p1.z))
  var y1 = Math.round(p1.y * (screen_dist / p1.z))
  var x2 = Math.round(p2.x * (screen_dist / p2.z))
  var y2 = Math.round(p2.y * (screen_dist / p2.z))
  drawLine(ctx, x1 + PIXEL_WIDTH/2, y1 + PIXEL_HEIGHT/2, x2 + PIXEL_WIDTH/2, y2 + PIXEL_HEIGHT/2)
}
And adding code to drawFrame to actually draw them from point to point, suitably transformed as before:
for (var j = 0; j < edges.length; j++) {
  var p1 = cube[edges[j][0]]
  var p2 = cube[edges[j][1]]
  ctx.fillStyle = "blue"
  var newP1 = {x: p1.x + transform.x, y: p1.y + transform.y, z: p1.z + transform.z}
  var newP2 = {x: p2.x + transform.x, y: p2.y + transform.y, z: p2.z + transform.z}
  drawLine3d(ctx, newP1, newP2)
}
And run it:
And done!
Conclusion
Pleased with the days work! Was not nearly as hard as I expected, so maybe I can do this 💪
On to Day Two…