jruby-prof 0.1
Redcar’s new snippet feature felt a bit slow to me, so I went to set up a profiler. In theory, JRuby profiling should be terrific right? It’s on the Java platform, deep integration etc etc.
I spent some time looking into the options:
-
set_trace_func There’s the pure Ruby profiler that is in the stdlib: this is slow and can only produce flat method time tables, no call graphs. But I do like that it can fit on one screen of code.
-
Java profiling tools I tried VisualVM and YourKit, YourKit was the winner, mainly for not segfaulting my JVM. (Yikes, VisualVM, yikes.) If you force JRuby to compile every method, then JRuby methods show up in a Java backtrace. This method is quite painful, because every single JRuby method call has about 3 Java calls in between that you have to click through, leading to very, very deep call trees. And you can’t tell which classes your methods are defined on.
Neither of these were exactly what I wanted, so when I had a day off on Tuesday, and in between epic bouts of Sex and the City, I had a go at writing a better profiler.
Turns out, it was really not that hard at all. JRuby internals are easy to understand and support the same kind of RubyEvent hooks that MRI does.
Install
jruby-prof is available as a gem.
The README and code are here.
How it works
When you load jruby-prof, it loads a compiled .jar file, which contains some Java classes for processing
JRuby events. Because the event handler is written in Java, it’s fast, like the ruby-prof
event handler, which is written in C.
Every time JRuby calls a method or returns from a method, it sends an event out to the handler with
information like the method name, the implementation class, and the current JRuby stack for this Thread.
jruby-prof processes that and keeps a tree of method invocations with durations.
When you’re done profiling, jruby-prof can take that tree and turn it into many kinds of pretty output.
Features
If you’ve ever profiled Rails code before you’ve probably noticed how everything eventually calls eval,
or render, or even just Array#each, and then you lose the trail of the offending code because every invocation of
eval or render is merged into one, and it’s not possible to see what part of their time is down to your code.
jruby-prof has an HTML Call Tree view that solves this problem.
It actually supports 5 output types:
(These examples were generated by running jruby-prof against the pidigits benchmark from the
Alioth shootout. )
The first three are the same as ruby-prof outputs (and the CSS is taken from the ruby-prof
project - thanks!).
The Text Call Tree is a simple dump of the method invocation tree, with durations attached. Methods appear
more than once in this tree, depending on where they are called. For instance, PiDigitSpigot#next! calls
itself, and you can see how much time is spent in each recursive call.
Similarly for the HTML Call Tree. This is just a more readily browsable version of the Text Call Tree. It looks
a lot like the regular ruby-prof call graph output, but don’t be fooled. Methods appear multiple times,
once for each location of where they are called, and the rows above the method have a different meaning.
Let’s break down two example rows:
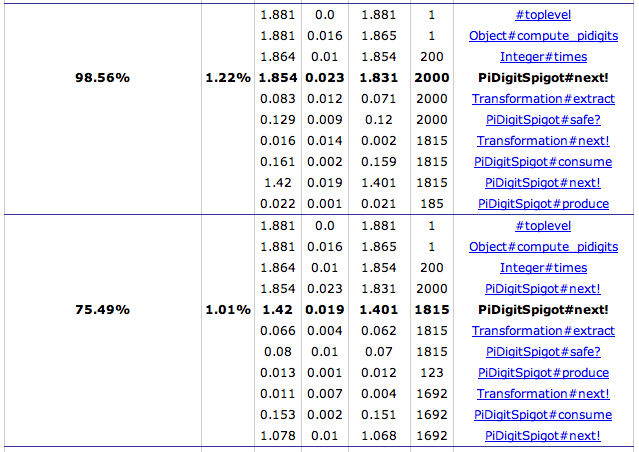
This shows two benchmark rows for the same method PiDigitSpigot#next!. The first row shows information about
all the times that next! was called from Integer#times, which had itself been called by Object#compute_pidigits,
which had been called from the toplevel of the script.
This differs from regular Call Graphs because that doesn’t
mean that all of those methods called next!. Only Integer#times called next!. But when it did, Integer#times was
itself called by compute_pidigits. This row shows that next! was called in this position 2000 times for a total
duration of 1.854 seconds.
The children (still in the first row) show that next! calls itself 1815 times. Therefore there is another
table row for that invocation, which is the second row in the example. In the second row, you can see the parents of
next! now include next! itself.
You can continue down this tree, as this invocation of next! again calls itself, but this time only 1692 times for
a total of 1.078s. If you keep clicking, it will take you down, down, down the tree until it reaches the very bottom.
(Except that this output will not show method invocations that add up to less than 5ms - otherwise it would be huge).
I’m looking forward to having a chance to use this on some real bad Rails code, because I think it will make things a lot easier.
Overhead
Thankfully, all of this doesn’t add much overhead to your code. You have to run your script with the --debug flag, which
adds a bit. Then turning tracing on adds a bit more. Here are the times for calculating 2000 digits of pi on my machine with
JRuby 1.5 and no special options set (and two previous warmups:)
jruby:                     1.362s
jruby --debug:             1.399s
jruby --debug + profiling: 1.904s
That’s only a 40% slowdown, which is a terrific result. (Caveat: I haven’t tested this across many types of script, and I have no idea how well it scales if you profile long running scripts.)
Limitations
I just wrote this on Tuesday, and rewrote part of it yesterday, so it’s very unfinished, and may have significant bugs.
Here are things that need fixing or implementing:
- Not thread safe. This needs fixing right away.
- Only one measure mode, which is Wall time. It should be easy to add User and System Times.
- I’d like to add an allocations/memory allocated measure modes, but I’m not sure how to get this info out of JRuby yet.
- It should record Java method calls.
- It should be possible to reduce the overhead further, since I’ve implemented the data structures in the most naive possible way.
Let me know if you have any trouble, and enjoy!